
Help Sage Active improve discoverability, engagement, and user activation through data-driven lifecycle initiatives

Bridging product value and user adoption for Sage Active
Project time: 2025-now
Role: principle growth designer
Project type: Product-led growth
What is Sage Active?
Sage Active is a cloud-based business management software designed for small and medium businesses to manage accounting, invoicing, payments, and financial workflows in a more connected and accessible way.
QUIZ
In this project, did I work as a Product designer?
Yes!
Because I worked on:
Onboarding experiences
Feature engagement
Lifecycle journeys
Behavioral UX optimization
But also...No!
Instead, I'm part of GID-
Growth innovation Design
We operate with a fast-paced, data-driven approach, continuously experimenting to uncover what drives value for our users and to bridge the gap between product capabilities and meaningful user adoption.

Design& insights
Softwares for design and inspiration

Figma/ Adobe
Create design proposal, visualize the idea

Lovable
Quickly turn design concepts into interactive models

Dovetail
User research, user study and related articles
Reporting & Analytics
Tools for data analysis and sharing

Power BI
Include data from all reporting resources

Pendo
For usage analytics, surveys, and in-product experimentation
Miro
Team collaboration and documentation

GID focuses on the Bottom of the Funnel
GID’s work is concentrated on Activation and Retention - the moments where users experience value and build long-term habits.
Our focus is on the product experience, not on marketing or customer acuisition.
WHY IT MATTERS_
Activation + Retention =
Because more activated user convert, more retained users expand. Together, they create sustainable growth.
Drive Revenue
Key challenges of Sage Active
As Sage Active expanded its capabilities, a growing gap emerged between product functionality and actual user adoption
High early-stage churn rate
Many users disengaged within the first days of using the product
Weak feature discoverablity
Many users disengaged within the first days of using the product
Fragmented onboarding experiences
The onboarding process in the product does not help users quickly understand the product features
Limited activation behaviors
Trying a feautre did not necessary translate into long-term adoption
DIGITAL AND DESIGN TRANSFORMATION_
These challenges highlight the pain points that traditional software companies face during their transformation
With market competition becoming increasingly intense, a good user experience has become the most important aspect of a product.
Users now expect to discover, experience, and adopt product value independently - without replying heavily on sales team or customer support
Traditional software
Built around sales, expertise, and ongoing support.
Sales-led
Expert-oriented
Support-dependent
Complex workflows
Training-heavy

Modern SaaS
Built around product-led growth and user autonomy.
Product-led
Self-serve
Intuitive
Guided experience
Fast activation
It’s why we work with the Product-Led-Growth approach
Product-Led-Growth(PLG) is a growth approach where the product itself becomes the primary driver of user acuisition, activation, and retention.



Rapid experiment and data analysis
To support rapid experimentation and continuous product adoption initiatives, GID primarily relied on Pendo as a lightweight implementation and behavioral analysis layer.
Pendo allows the team to quickly collect usage insights, deploy contextual guides, validate adoption hypotheses, and iterate on life cycle experiences without depending on long development cycles.

+
DESIGN DIRECTION AND DESIGN STRATEGY_
PLG is a cross-team collaboration, we need to not only know the product development, but also understand the product roadmap, user behavior, sales strategies, key selling points, and other related things.
With market competition becoming increasingly intense, a good user experience has become the most important aspect of a product.
Users now expect to discover, experience, and adopt product value independently - without replying heavily on sales team or customer support

PLG IN ACTION:
Measurable product impact*
Our cross-functional UX and Growth initiatives contributed to meaningful improvements in user growth, retention, and product adoption - reflected in the results here:
*These achievements are the result of a collaborative effort across multiple departments and are not the sole accomplishment of GID or PLG.
+640%
User base growth in one year
+37%
User retention improvement
98.7%
E-invoicing registration rate
Key challenges of Sage Active
As Sage Active expanded its capabilities, a growing gap emerged between product functionality and actual user adoption
1. Feature engagement & Lifecycle communication
Introduced contextual guidance and lifecycle communication to improve feature discoverability and long-term engagement.
2. New feature adoption
Designed a lifecycle-driven adoption journey to support the launch, activation, and engagementon online payment, bank connection, AI features etc.
3. Onboarding Optimization
Improved onboarding experiences and use AI to reduce early churn and help users reach product value faster.

SHOWCASE 1 : WELCOME&ACTIVATION HUB_
From First Login to First Value
A self-serve welcome experience designed to help new users discover the product, learn key capabilities, and find the right path to value.
1.Background
Sage Active was facing significant early-stage churn. Only 40% of trials converted to paid users, while a large proportion of users disengaged before experiencing enough of the product's core value.
Nº | Parcours | Data |
|---|---|---|
1 | User used the product for less than 2 hours | 39% |
2 | From Trial to Paid | 40% |
3 | Users cancelled their trial on Day 1 | 41% |
4 | Users who cancelled never returned | 90% |
Users were leaving before they had enough time to discover what Sage Active could actually do for them. The opportunity was clear: help users understand the product's value and get started as quickly as possible.
2.Design goals
Our goal was not to introduce more information, but to create a clearer path from first login to product value.
Reduce Early Churn
Help users stay engaged during the critical first days of their trial.
Accelerate Product Adoption
Help users quickly discover and start using Sage Active's key features.
Enable Self-Serve Learning
Give users the guidance and resources they need to explore the product independently, without relying heavily on Sales or Support.
3.Analyze the journey & find opportunities
To understand what was preventing users from reaching product value, we analyzed their early journey across multiple behavioral signals.
Journey | Drop-off rate |
|---|---|
First login → Mandatory onboarding | 3% |
Homepage → Sales invoice list | 19% |
Sales invoice list → Create new invoice | 77% |
Save invoice → Record payment | 18% |


The data showed that users who successfully completed the initial invoice creation were much more likely to continue through the rest of the workflow, all the way to recording payment.
This suggested that the main challenge was not long-term engagement itself, but helping users overcome the friction between entering a workflow and reaching their first successful outcome.
The opportunity
If users receive clear, actionable guidance on what to do first — such as recommended next steps or onboarding sessions — they will be more likely to engage with core product features early, leading to faster activation, stronger product adoption, and lower churn.
4.Design approache .
Rather than relying on a single onboarding path, we designed a layered experience that allows users to explore independently, access additional support when needed, and continuously share feedback.

01 — Self-serve Exploration
Help users get started on their own.
We identified two core product features with low adoption and created step-by-step guides to help users complete them. A product walkthrough video provided a broader understanding of how the key workflows connect.
02 — Guided Support
Give users a way to go deeper when they need help.
For users who needed more support, we introduced direct access to webinars, providing a more comprehensive product training experience and an opportunity to ask questions.
03 — User Feedback
Turn the onboarding experience into a learning loop.
We integrated a satisfaction survey to capture user feedback, identify friction points, and generate insights for future product improvements.
5.Solutions .
A product-led onboarding experience designed to accelerate value discovery, encourage feature adoption, and reduce early-stage drop-off.
Problem | Solution | Intended behaviour |
|---|---|---|
Feedback or suggestions about the product | Satisfaction survey | Share feedback |
Some unique questions | Webinar | Seek additional support |
Difficulty to use this feature correctly | Feature guides | Try and complete key actions |
Confusion About the journey | Product video | Understand the product workflow |
We will use this guide as a variant and conduct an A/B test against the current standard version of the product, with traffic split 50/50, targeting a total of 1,000 new users in France, Spain, and Germany over the duration of a one-month test.
Success measures:
Click through rate(CTR)
Activation rate: volume of users that engaged&completed startup tasks
TTV: Time taken to first engagement with sales and purchase invoice tasks
Time taken to complete by attempts
Early day chun: day 0-7 users
Seek correlation between those that interacted with the experiment and retained or more engaged with product. (Days active, Login rate etc.)
6.Result & Impact
A more self-serve onboarding experience helped turn early product exploration into meaningful user engagement.
Metric | Expectation | Result |
|---|---|---|
Video click(watch) rate | +10% | 31%(+9%) |
Create new invoice | +10% | 36% (+11%) |
Time to complete sales invoice | -25% | 4m11s(-44%) |
Post purchase invoice | +10% | 64%(+50%) |
Complete webinar subscription | +10% | 58% (+17%) |


Following the A/B test, we achieved results that exceeded our expectations. Overall, the final results were stronger than initially anticipated, with significant improvements in both click-through and completion rates for key features. In particular, Purchase Invoice usage increased by 50%, while the time required to create a Sales Invoice decreased by 40%.
Even more encouragingly, the user churn rate decreased from 55% to 46%. This demonstrates that the experiment had a very positive impact and validates our hypothesis: providing new users with a clear and structured onboarding experience is essential for improving the overall user experience and reducing user churn.
In the meanwhile, we also found that the average time of watching video is 6.3 mins(the duration of video in our guide is around 1h), so keep the video short and efficient is the key of success.
7.From Experiment to Product Evolution
Our onboarding experiment demonstrated that early guidance played a critical role in helping users discover product value. The insights were brought back to the product team and contributed to a broader rethinking of the onboarding experience.
Onboarding journey update
Building on the insights from our experiments, the product team redesigned the onboarding experience around faster value discovery and self-serve learning.

AI-powered onboarding
Instead of presenting users with predefined guides, an AI agent can interact with users directly, understand what they want to accomplish, and demonstrate relevant product capabilities through conversation.
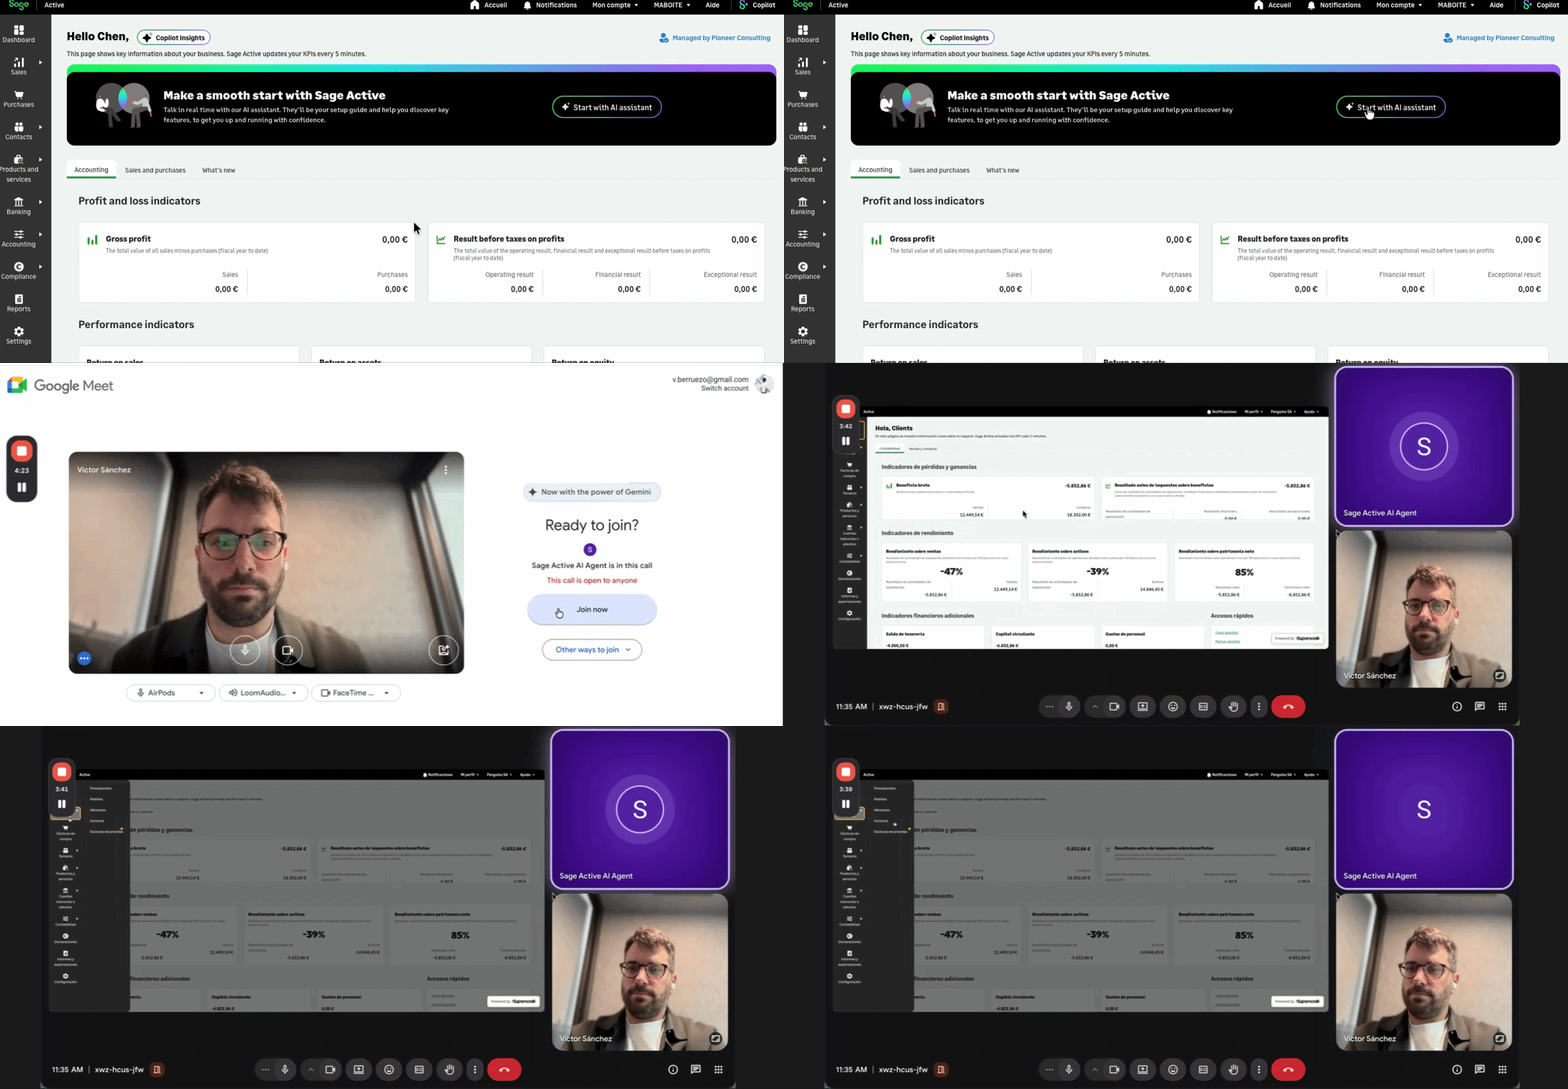
What started as a lightweight Pendo experiment became a catalyst for rethinking onboarding at the product level

SHOWCASE 2 : NEW FEATURE ADOPTION DESIGN_
Online payment in product
In the following section, I will explain how we developed a detailed PLG plan for the new online payment feature.
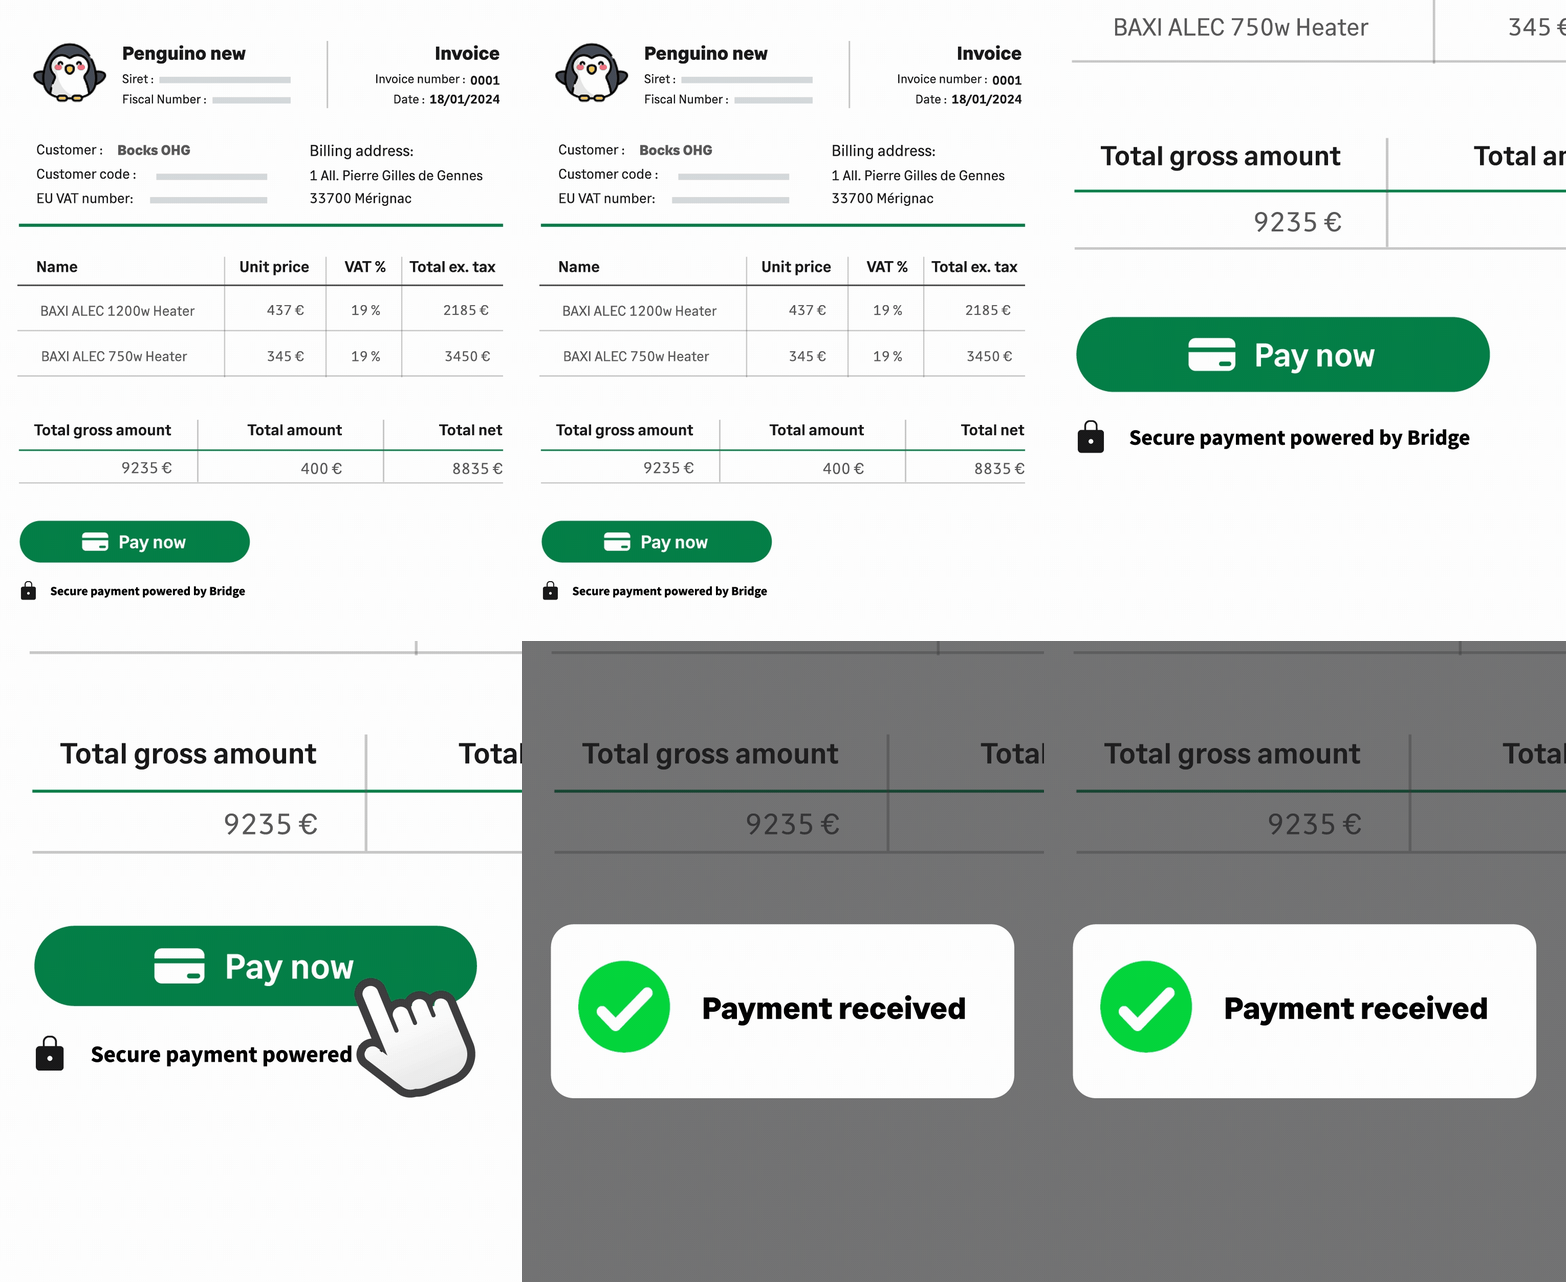
*What is online payment?
The online payment feature in invoicing software lets clients pay bills electronically by clicking a "Pay Now" button directly on a digital invoice.
Design experiments
Our testing strictly follows the process from awareness to retention
Awareness
Aqcuisition
Activation
Engagement
Retention

Pendo guides creation
Our testing strictly follows the process from awareness to retention

AWARENESS_
Pre-launch .
Before the feature was released, we added a banner to the product’s main page to announce its upcoming launch and generate user interest by offering the option to “notify me”

AQCUISITION_
Feature launch .
When the feature is officially launched, we created a guide which includes an animation, to draw users attention


Action related .
After users recording a paymentm a guide will show up to demonstrate the value of online payment.
ACTIVATION_
ACTIVATION_
Action related .
When users is reviewing the invoice, a guide shows up next to the invoice, in introducing the benefits.


ACTIVATION_
Action related
Below the user's payment terms, there is a small banner (this is where the payment link is located) that allows users to set up online payment.
ENGAGEMENT_
Action related .
After users activate the online payment feature, we’ve added a help icon in the corresponding area of the feature. By clicking the icon, users can view detailed information about how to use the feature.


RETENTION_
In-product survey .
For the users who activated the online payment, we sent them a survey to gather their feedback . in aim of optimizing the feautre.
Continuous follow-up
Our testing strictly follows the process from awareness to retention
Dovetail
User research & User analysis
When users do feature-related actions, a guide pops up to communicate the feature's value and USP


Pendo
Performance tracking
When users do feature-related actions, a guide pops up to communicate the feature's value and USP

Power BI
Task managment
When users do feature-related actions, a guide pops up to communicate the feature's value and USP
Final result .
Based on the final data analysis, the subscription and usage rates for this feature did not meet expectations:
8.7%
Registration rate
The number of feature subscriptions is lower than expected
209
Payment link created
Low payment link creation
3/5
NPS rating
Users still have many questions about the feature
This project provided us with valuable insights.
Through experimentations and data analysis, we determined that this feature was not adequately prepared; the product team had failed to conduct thorough market, user, and feature research at the beginning of this plan, which ultimately led to its failure.
As a result, the PLG’s efforts ultimately proved ineffective, but we've learnt a lot and we're on the right path to improve the product.
Other projects
Our testing strictly follows the process from awareness to retention
Rollout of E-Invoicing in Europe.
I'm a paragraph. Click here to add your own text and edit me. It's easy.

Product videos .
I'm a paragraph. Click here to add your own text and edit me. It's easy.

E-mail journey nurturing .
I'm a paragraph. Click here to add your own text and edit me. It's easy.
